Greetings!
The weekly numbers were relatively quiet, but the 30-day picture is more telling.
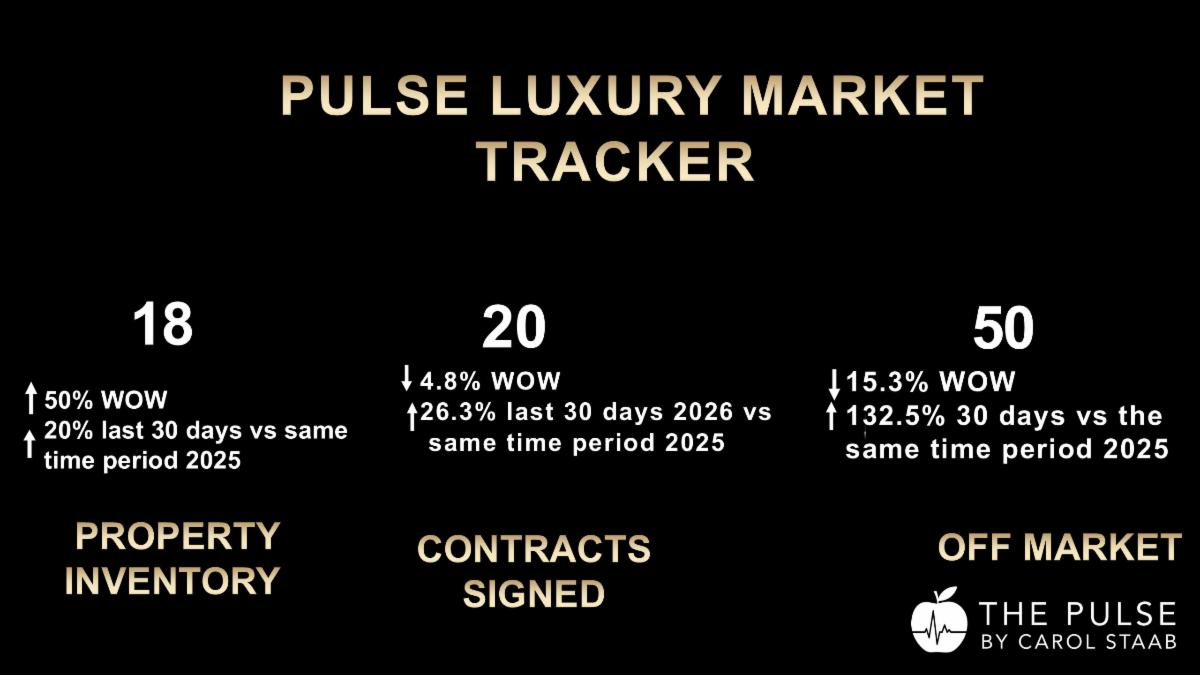
Over the past 30 days, 96 Manhattan properties priced at $4 million and above entered contract—26.3% more than during the same period last year. At the same time, 265 listings went off market, an increase of 132.5% year over year.
The contrast between those two numbers is what interests me.
Buyer activity is running well ahead of last year, while a large number of sellers are temporarily stepping away from the public market. July and August are traditionally slower listing months, and many owners use this period to reassess their strategy before returning after Labor Day. Some of those properties remain quietly available through brokers and private listing networks.
The result is a market that looks softer on the supply side than the contract activity would suggest.
Weekly Market Snapshot | Manhattan $4M+
- 20 contracts signed | ▼ 4.8% from 21 last week
- 18 new listings | ▲ 50% from 12 last week
- 50 listings went off market | ▼ 15.3% from 59 last week
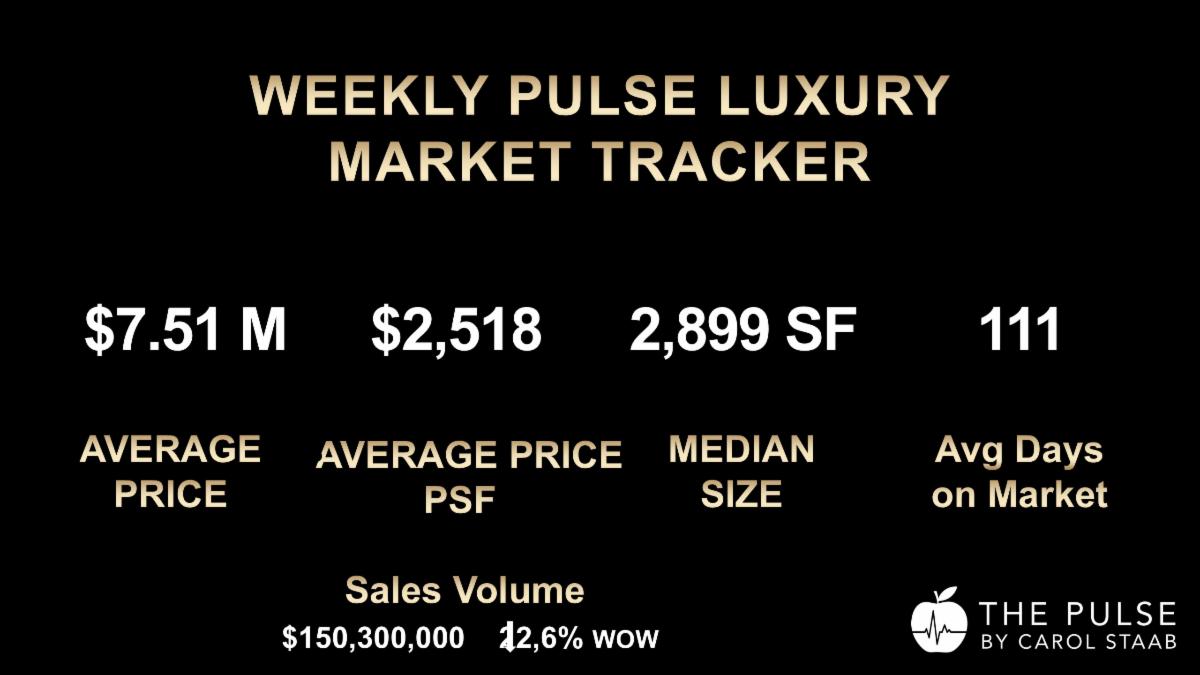
- $150.3M asking-price volume | ▼ 22.6% from $194.2M last week
- 2 contracts above $10M | 10% of contracts | down from 5 / 24% last week
- 4 new-development contracts | 20% of contracts
The contract count changed very little from last week.
The more noticeable shift was above $10 million, where contracts declined from five to two. That helped bring total asking-price volume down 22.6% week over week.
30-Day Market View
- 96 contracts signed vs. 76 last year | ▲ 26.3%
- 84 new listings vs. 70 last year | ▲ 20%
- 265 listings went off market vs. 114 last year | ▲ 132.5%
The 30-day numbers provide useful context for what we are seeing in August.
Contracts are running more than 26% ahead of the same period last year, even as off-market activity has more than doubled. I would not interpret the surge in withdrawals as evidence that buyers have disappeared.
A meaningful portion of this is seasonal. Sellers often pause during the quieter summer weeks, reset Days on Market and return after Labor Day. Some properties also remain available privately even though they no longer appear on the major consumer websites.
The stronger contract activity is an important counterweight to the headline inventory numbers.
Market Diagnosis | The August Reset
When I look at the current market, I see two forces operating at the same time.
Buyer demand remains active, although selective. On the seller side, August is being used as a reset period.
For some owners, coming off the market is a strategic decision rather than an abandonment of the sale. The intention may be to return in September with a refreshed listing date, new photography, revised pricing or a different marketing approach.
The question is whether the strategy changes along with the listing date. If a property did not sell the first time, simply resetting Days on Market does not address the reason buyers did not respond. That is where the real work begins.
Property Type Breakdown
- Condominiums: 14 contracts | 70%
- Co-ops: 3 contracts | 15%
- Townhouses: 2 contracts | 10%
- Other / Rental-designated: 1 contract | 5%
Condominiums remained the dominant property type, accounting for 70% of this week’s $4M+ contracts.
Neighborhood Performance
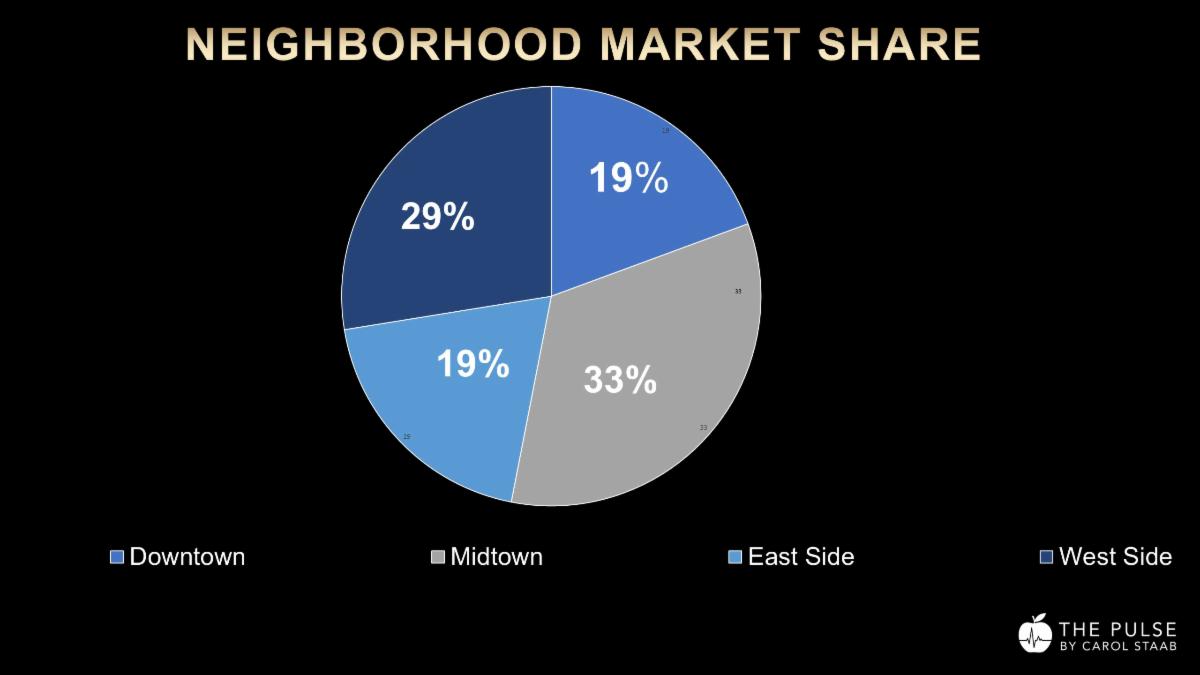
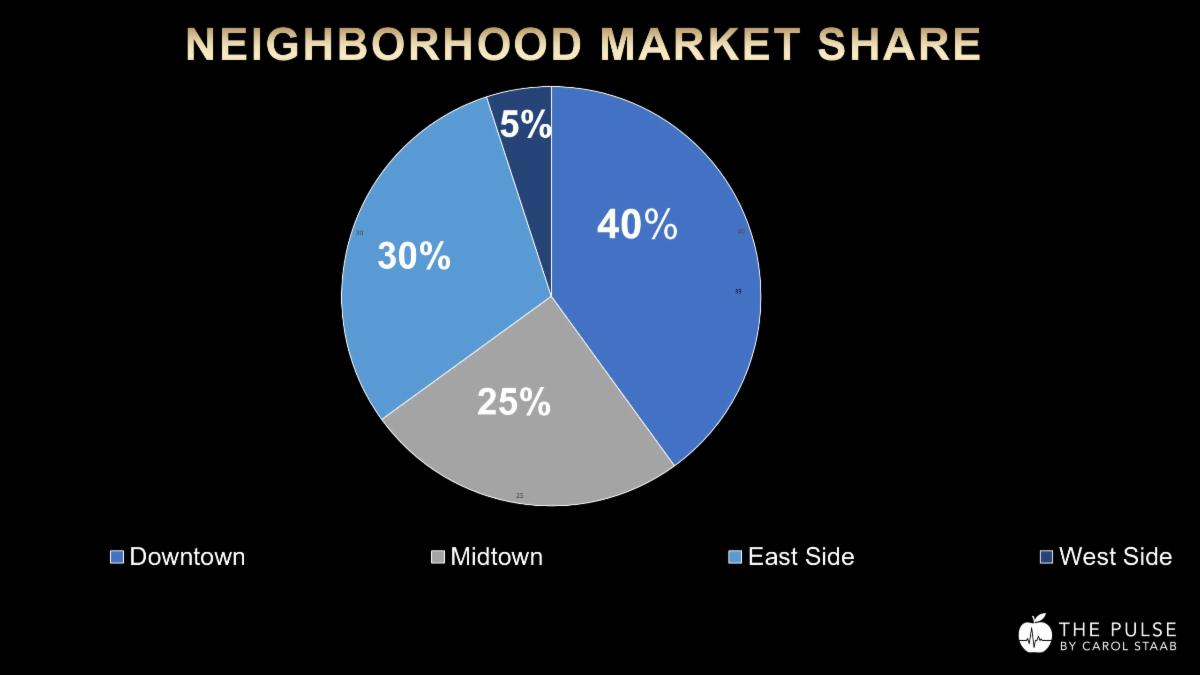
- Downtown: 8 contracts | 40%
- Upper East Side: 6 contracts | 30%
- Midtown: 5 contracts | 25%
- Upper West Side: 1 contract | 5%
Downtown led the market this week with 40% of all contracts, followed by the Upper East Side at 30%.
New Development
4 contracts | 20% of the market
New development accounted for one in five contracts and produced both of the week’s largest transactions.
Market Pulse & Listing Climate
$4M+ Market
Market Pulse: 3.45 ▲ 1.3 points month over month ▲ 1.4 points year to date ▲ 1.6 points year over year
Listing Climate: 0.51 ▼ 60.5% month over month ▼ 12.1% year over year Challenging market threshold: 0.57 Easy market threshold: 1.27
The Market Pulse remains firmly positive and has improved on a monthly, year-to-date and year-over-year basis.
The Listing Climate, at 0.51, is below the challenging-market threshold. I think the seasonal context is particularly important here. Fewer properties typically come to market in July and August, while many existing listings are deliberately withdrawn before the fall season.
That can push the Listing Climate down quickly even when buyer activity remains relatively healthy.
The 26.3% year-over-year increase in 30-day contracts supports that interpretation.
$10M+ Market
Market Pulse: 0.40
▲ 0.7 points month over month ▲ 0.2 points year to date ▼ 0.7 points year over year
Listing Climate: 0.12
▼ 86.2% month over month ▼ 66.7% year over year
Challenging market threshold: 0.38 Easy market threshold: 0.86
The $10M+ Market Pulse has returned to positive territory, although it remains below last year.
The Listing Climate remains extremely low at 0.12.
Only two properties above $10 million entered contract this week, compared with five last week.
At this level, buyers have considerable choice and very little reason to compromise. They will act when the property, price and value proposition come together.
#1. 175 Fifth Avenue, Residence 17 North | FlatironAsking Price: $23,950,000 New Development Condominium | Historic Flatiron Building Conversion 4 Bedrooms | 4.5 Baths | 4,627 SF $5,176 PSF
#2. 500 West 18th Street, Residence W22A | ChelseaAsking Price: $10,950,000 New Development Condominium | One High Line 3 Bedrooms | 3.5 Baths | 2,345 SF $4,669 PSF 80 Days to Contract \
Seller Advice | Before You Relaunch, Understand Why It Didn’t Sell
If I were advising a seller preparing to return to the market after Labor Day, I would not begin with the listing date.
I would begin with the reason the property did not sell the first time. Was it the price?
Was the online presentation strong enough to stop a buyer scrolling through competing listings?
Was the property positioned correctly against recent sales and current competition?
Is there something about the building, carrying costs or condition that buyers are reacting to?
And was the marketing strategy reaching the right audience? A fall relaunch can create renewed attention, but only if the underlying issues have been addressed.
A new listing date is useful. A better strategy is far more valuable.
Buyer Advice | Some of the Market Has Gone Quiet, Not Away
August can be an interesting month for buyers because the public market does not necessarily show everything that is available. Some properties that have been withdrawn remain quietly accessible through brokers and private listing networks. Other sellers may be willing to entertain an offer before formally returning in September. That does not mean every stale or off-market property represents value. The opportunity comes from understanding the property’s pricing history, the building, recent comparable sales, competing inventory and the seller’s position.
That information can matter just as much as the asking price.
What I’m Watching | Pied-à-Terre Tax: What Will Buyers Do?
New York City is continuing the rollout of the pied-à-terre tax while the legal challenge moves forward.
For Manhattan luxury real estate, I am less interested in predicting the legal outcome than in watching what buyers actually do.
Jonathan Miller, a Manhattan real estate market expert and author of the Housing Notes sees the $5M–$10M market as potentially vulnerable because many second-home buyers in that range have alternatives. If the cost of maintaining a Manhattan residence becomes materially less attractive, some may look more seriously at Greenwich, the Hamptons or other markets.
That makes sense.
But the longer-term structure of the tax is still several years away, and a great deal can change between now and then. The rates could be modified, implementation could change, litigation could reshape the law or policymakers could respond to unintended market consequences. The real test will be whether we begin to see a measurable change in contracts, inventory or pricing among second-home buyers. That is what I will be watching.
Read the Reuters article → [LINK] Read Jonathan Miller’s Housing Notes → [LINK]
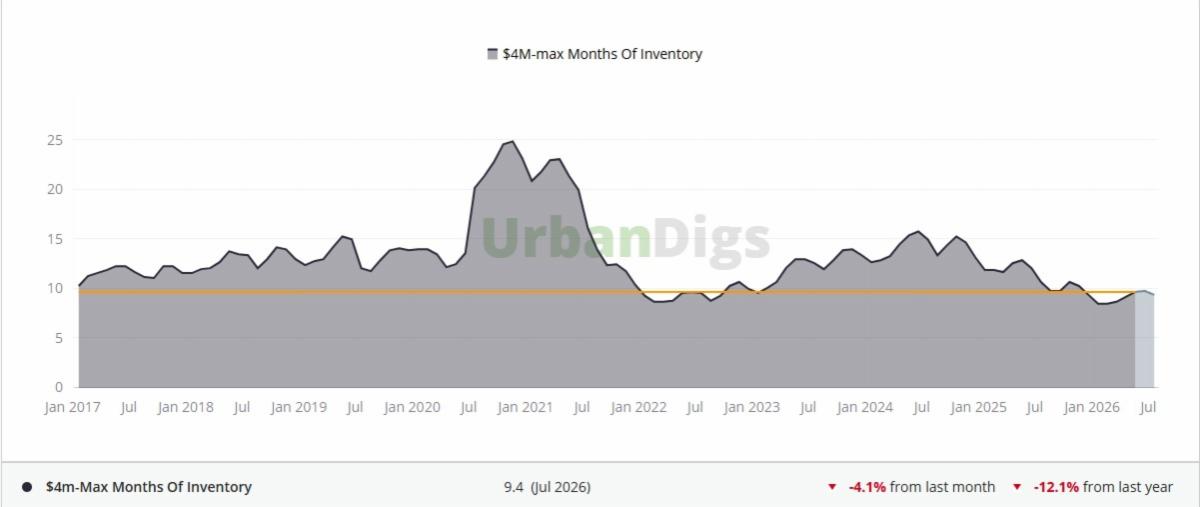
Chart of the Week- Inventory Levels
Inventory levels have dropped to 9.4 months - down 4.1% from last month and down 12.1% from this time last year.We have burned through a lof of inventory and levels have greatly reduced. Also we need to take into account that there is a percentage of the inventory that is undesirable and or vastly overpriced. After making adjustments for those factors the availlable inventory is even lower.
Final Thoughts
August is giving us an unusual combination of numbers. Weekly contracts remain relatively steady, while 30-day contract activity is 26.3% ahead of last year.
At the same time, off-market activity is up 132.5%.
To me, that does not suggest a luxury market where buyers have suddenly disappeared.
It suggests that buyers remain selective and active, while many sellers are deciding to wait for the fall market.
September should bring more inventory—and with it, more competition. For sellers preparing to return, this is the time to look carefully at what worked, what did not and what needs to change.
Is Your Property Lingering on the Market?
When a property has been sitting without the buyer response you expected, my first question is not automatically, “How much should we reduce the price?”
It is “Why isn’t the market responding?” My Real Estate Doctor Diagnostic looks at the entire picture: pricing, competitive positioning, online marketing and presentation, building performance, recent comparable sales, current market conditions and buyer response.
Sometimes the problem is price.
Sometimes it is presentation or positioning.
Sometimes the building or competition is influencing the result. Often, it is a combination.
If your Manhattan property has been lingering on the market—or you are considering a fall relaunch—I would be pleased to provide a confidential diagnostic assessment and identify what I believe needs to change before the property returns to market. Email me here.
If you know someone who would value the Pulse please share it.
Warm regards, Carol Carol Staab Sotheby's International Realty
Ranked by Real Trends -Top 1.5% of real estate professionals nationwide Ranked by Real Trends #48 in NYC & #5 for individuals Sotheyb's NYC Top 100 Sotheby's Company Wide Global Real Estate Sales Advisor My Notable Sale Ritz Carlton $28.4M
Email: [email protected] Cell: 917-273-7787 Website: CarolStaab.Com Subscribe to the Pulse Here
|