Greetings!
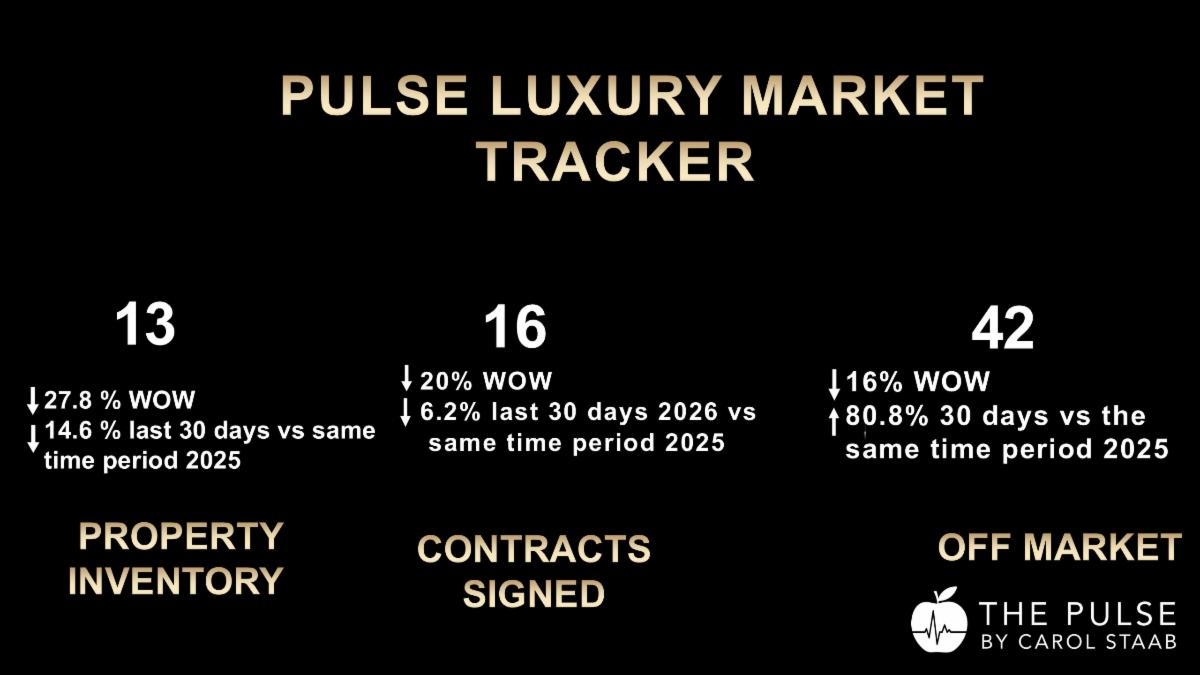
This week, Manhattan's $4M+ market recorded 16 contracts — the first time that number has dipped below 20 since 4th of July holiday week.
I would not read that as a shift in demand.
The final two weeks of August are historically among the lowest-volume periods of the year. Activity slows — not because buyers lose interest, but because the calendar does what the calendar always does in late summer. The 30-day numbers tell a more complete story. Contract activity is running just 6.2% below the same period last year — a modest pullback, not a retreat. At the same time, new listings are down 14.6% year over year, and off-market withdrawals are up nearly 81%.
A significant portion of that off-market activity is deliberate. Many sellers are pulling their listings from the public consumer portals to avoid accumulating Days on Market during the slowest weeks of the year. The plan is to return in September with a reset clock and, in some cases, a revised strategy.
Whether that works depends entirely on what changes between now and then. A new listing date is not a new strategy.
What I see is a market where supply is thinning on both sides — fewer new listings entering and a large number being deliberately withdrawn — while buyer activity has held within a tight range of last year's pace. The buyers who are active remain selective — as they have been all year. For sellers preparing to return after Labor Day, the math is straightforward. Less new inventory coming to market means less competition — but only if your property is properly priced and positioned. The sellers who benefited from reduced competition last fall were the ones who came back with a genuine strategy, not just a new listing date.
Weekly Market Snapshot | Manhattan $4M+
16 contracts signed | ▼ 20% from 20 last week 13 new listings | ▼ 27.8% from 18 last week 42 listings went off market | ▼ 16% from 50 last week
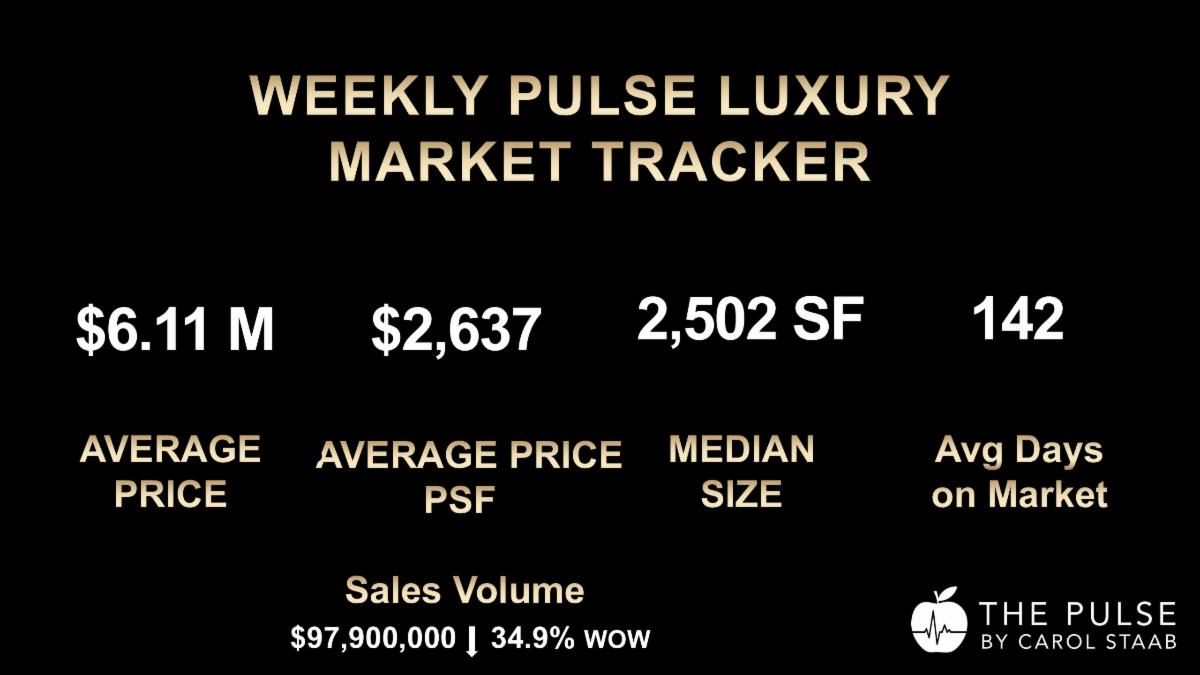
$97.9M asking-price volume | ▼ 34.9% from $150.3M last week 1 contract above $10M | 6.3% of contracts | down from 2 / 10% last week 3 new-development contracts | 18.8% of contracts
The decline was broad-based. Fewer contracts, fewer new listings, fewer withdrawals.
$10 million & Over - only one property entered contract this week — down from two last week and five the week before. That single transaction accounted for most of the drop in total asking-price volume.
30-Day Market View
91 contracts signed vs. 97 last year | ▼ 6.2% 76 new listings vs. 89 last year | ▼ 14.6% 264 listings went off market vs. 146 last year | ▲ 80.8%
This is where the story gets more nuanced.
Contract activity over the past 30 days is running 6.2% below last year — a modest pullback, not a collapse. New listings are also down, falling 14.6% year over year. And off-market withdrawals are up nearly 81%.
The supply side is contracting from both directions — less inventory entering and more inventory leaving. Buyer activity, meanwhile, has remained remarkably stable relative to last year's pace.
That tells me this is a market tightening on the supply side, not weakening on the demand side.
Market Diagnosis | Late August in Context
The weekly number is 16. The diagnostic question is whether that number reflects demand or calendar.
Every year, the final two weeks of August produce some of the thinnest contract activity on the calendar. That pattern is reliable enough that I treat it as structural, not symptomatic.
What I am diagnosing instead is September. New listing activity is running below last year, which means less inventory is entering the pipeline than at the same point in 2025. If that trend holds into fall, properly priced and positioned properties will face less competition — and the sellers who have done the diagnostic work before relaunching will have a meaningful advantage.
The demand is there. The 30-day contract pace confirms it. The question for sellers is whether their property is positioned to capture that demand when the market reconvenes.
Property Type Breakdown
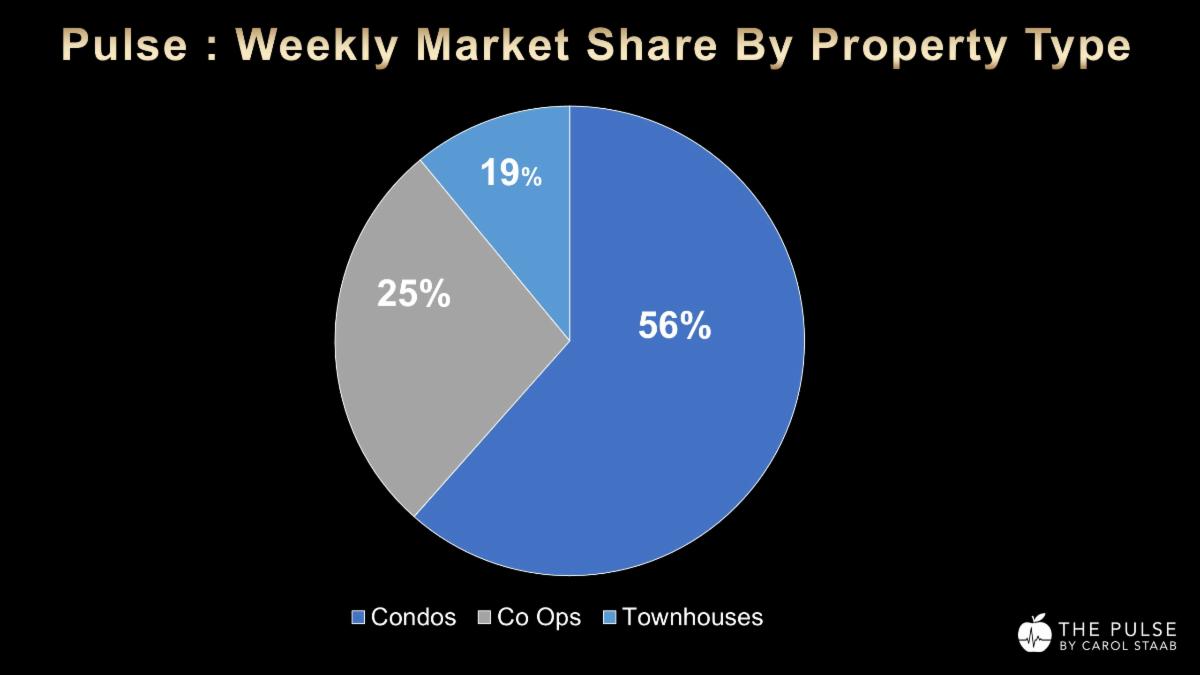
Condominiums: 9 contracts | 56.3% Co-ops: 4 contracts | 25% Townhouses: 3 contracts | 18.8%
Condominiums still led the market but at a notably lower share than last week's 70%. Co-ops picked up from three to four contracts, and townhouses had a strong week with three transactions — up from two.
Neighborhood Performance
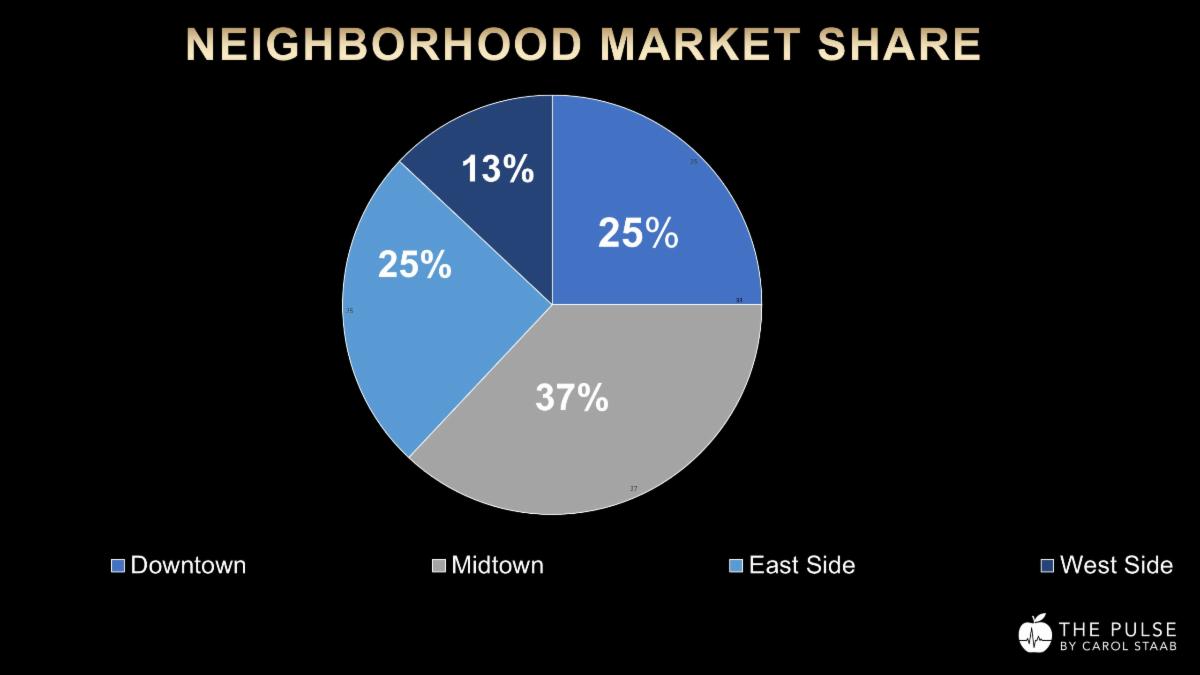
Midtown: 6 contracts | 37.5% Downtown: 4 contracts | 25% Upper West Side: 4 contracts | 25% Upper East Side: 2 contracts | 12.5%
Midtown led the market this week, a shift from Downtown's dominance last week. The Upper West Side was the standout — four contracts compared with just one the week prior. The Upper East Side, which accounted for 30% of last week's activity, pulled back to two contracts.
New Development
3 contracts | 18.8% of the market New development accounted for roughly one in five contracts, consistent with last week's share.
Market Pulse & Listing Climate
$4M+ Market
Market Pulse: 3.4
▲ 1.3 points from last month ▲ 1.3 points year to date ▲ 1.4 points from last year
Listing Climate: 0.51
▼ 60.5% from last month ▼ 12.1% from last year
Challenging market threshold: 0.57 Easy market threshold: 1.27
The Market Pulse remains firmly in positive territory and continues to improve across every timeframe — monthly, year to date and year over year.
The Listing Climate, at 0.51, sits below the challenging-market threshold. This is largely a reflection of where we are on the calendar. Late August is consistently one of the slowest periods of the year. Fewer listings are entering, a large number are being deliberately withdrawn, and the mechanics of getting deals signed slow down. That compresses the Listing Climate regardless of underlying demand.
The Market Pulse is the more reliable signal right now.
$10M+ Market
Market Pulse: 0.5
▲ 1.0 point from last month ▲ 0.3 points year to date ▼ 0.6 points from last year
Listing Climate: 0.12
▼ 86.2% from last month ▼ 66.7% from last year
The $10M+ Market Pulse remains in positive territory and improved meaningfully from last month, though it is still running below last year.
The Listing Climate at 0.12 is extremely low — again, driven primarily by late-August seasonality rather than a fundamental shift in buyer activity. Only one property above $10 million entered contract this week.
Buyers at this level have a thin selection of high quality properties, however they will not settle and are waiting for new inventory to come on the market or for a price reduction. If a property is of high quality yet needs a renovation, a buyer in this range may consider it if it represents a true value play. Sellers who want to transact in this range need to understand that this isn't the market for asprirational pricing.
Top Two Contracts | See All 16 Contracts
#1. 36 Bleecker Street, Unit 5A | NoHo
Asking Price: $11,500,000 Condominium 4 Bedrooms | 4.5 Baths | 3,280 SF $3,506 PSF 123 Days to Contract
#2. 2 East 70th Street, Unit 91011B | Lenox Hill
Asking Price: $8,950,000 Co-op 5 Bedrooms | 5.5 Baths | 4,300 SF $2,081 PSF 925 Days to Contract
Seller Advice | The September Window Is Not Automatic If your property has been off the market this summer, you are not alone.
Many sellers have made the same calculation — withdraw during the slowest weeks of the year, avoid accumulating Days on Market, and return after Labor Day with a fresh start.
That decision makes sense. What happens next is what separates the properties that sell from the ones that sit again.
A September relaunch creates a brief window of renewed attention. Buyers and their agents notice new listings. The first two weeks back on market tend to generate the most activity. After that, the property is no longer new — it is simply available.
If I were diagnosing a fall relaunch right now, I would be asking five questions before the listing goes live.
Is the pricing aligned with where the market is today — not where it was six months ago?
Has the photography and online presentation been rebuilt, or are you returning with the same materials that did not produce a result the first time?
Are the comparable sales you are referencing current, or are they from a different market cycle?
Is the marketing strategy targeting the right buyer profile — or just the widest audience?
And does the property show the way it needs to show at this price point?
The diagnosis comes first. The prescription follows. But both need to happen before the listing goes live — not after another sixty days without an offer.
September will bring more inventory and more competition. The sellers who do the diagnostic work now will have an advantage over the ones who are relying on a reset date to do the work for them.
Buyer Advice | Late August Through Early September Is Your Window
If I were advising a buyer right now, I would be focused on three things.
- The calendar. Inventory is elevated and many sellers who withdrew this summer remain quietly available through their brokers. Others who stayed on the market through August may be more flexible than their asking price suggests — particularly with Days on Market accumulating in a slow period. That dynamic shifts in mid-September when new inventory floods the market and competition among buyers increases.
- The diagnosis before the offer. Know what recent comparable sales tell you about value — not what the listing description tells you. Understand the building's financial health, recent sales activity and any factors that affect long-term value. If a property has been on and off the market, there is information in that pattern. Read it.
- The advantage of preparation. A well-researched offer made during a quiet week can accomplish what months of browsing in a competitive market cannot. The leverage right now belongs to the buyer who has done the work before the rest of the market reconvenes.
What I'm Watching | Neighborhood Days on Market — The Data Most Sellers Never See
Not all of Manhattan moves at the same speed. And at $4M and above, the neighborhood your property sits in can be just as important as the price on the listing.
This week I looked at average Days on Market by neighborhood across the $4M+ luxury segment. The range is striking.
Fastest Moving Neighborhoods $4M and over
- Chinatown: 20 days
- Battery Park City: 29 days
- West Village: 45 days
Slowest tMoving Neighborhoods $4M & Over
- Turtle Bay: 230 days
- Hell's Kitchen: 211 days
- Nolita: 158 days
That is a 210-day gap between the fastest and slowest neighborhoods. Same city. Same price threshold. Entirely different market realities.
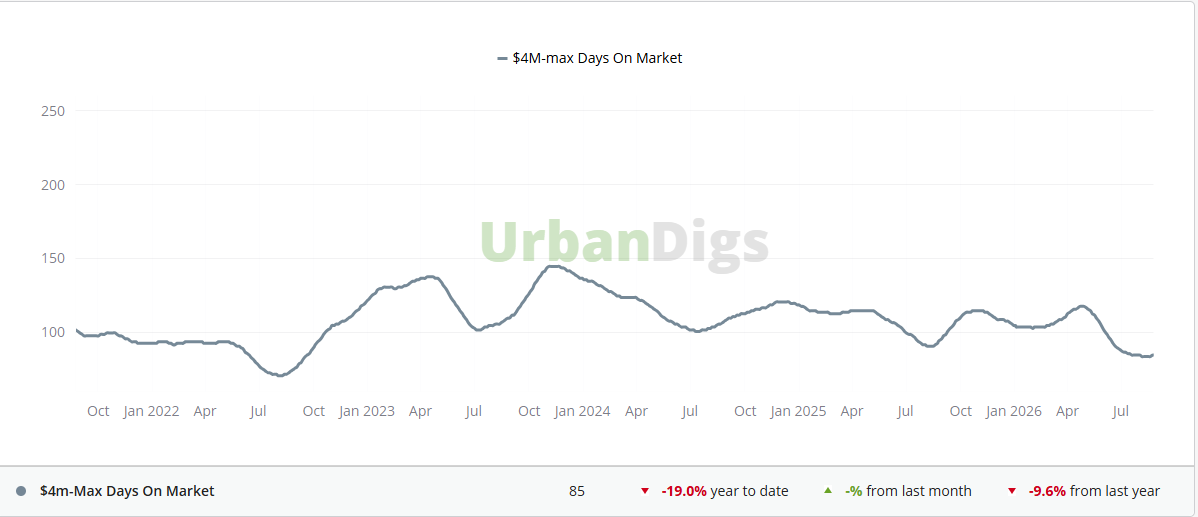
This week's Chart of the Week shows the overall Manhattan $4M+ Days on Market trend — the macro view. The neighborhood data above is where the real diagnostic value lives.
This matters because pricing does not exist in a vacuum. A seller in the West Village is operating in a market where well-priced properties are being absorbed in under seven weeks. A seller in Turtle Bay is competing in an environment where the average buyer takes nearly eight months to commit — if they commit at all.
If your pricing strategy does not account for your neighborhood's absorption rate, you are starting from the wrong baseline. And if your property has been sitting longer than the neighborhood average, the market is telling you something that deserves a diagnosis — not just a price reduction.
I can take this data further. By narrowing the price range — $4M–$6M, $6M–$10M, $10M and above — the picture becomes even more specific. If you want to understand exactly where your property stands relative to its true competitive set, that level of detail is where the real insight lives.
Final Thoughts
The market did not slow down this week. The calendar did. Sixteen contracts is a quiet number. But quiet weeks in late August are not a signal — they are a pattern. The 30-day view confirms that buyer activity remains within range of last year, even as the supply side tightens ahead of September.
New listings are running below last year. Off-market withdrawals have nearly doubled. The available inventory is shrinking — and for sellers who return after Labor Day with a properly diagnosed strategy, that is an advantage. For those who return with nothing more than a new listing date, the market will be no more forgiving than it was the first time.
A new listing date opens a window. Only the right strategy keeps it open.
If your Manhattan property did not produce the result you expected this spring — or you are preparing to return to market after Labor Day — the time to evaluate your strategy is now, not the week before you relaunch. My Real Estate Doctor Diagnostic examines the full picture: pricing, competitive positioning, online presentation, building performance, comparable sales and current market conditions.
The goal is not simply to identify what is wrong. It is to understand precisely what needs to change before your property re-enters the market.
I welcome confidential conversations with owners who expect more from the process.
[Email me here]
If you know someone who would value the Pulse, I would be grateful if you shared it.
Warm regards, Carol Carol Staab Sotheby's International Realty
Ranked by Real Trends -Top 1.5% of real estate professionals nationwide Ranked by Real Trends #48 in NYC & #5 for individuals Sotheyb's NYC Top 100 Sotheby's Company Wide Global Real Estate Sales Advisor My Notable Sale Ritz Carlton $28.4M
Email: [email protected] Cell: 917-273-7787 Website: CarolStaab.Com Subscribe to the Pulse Here
|