Greetings!
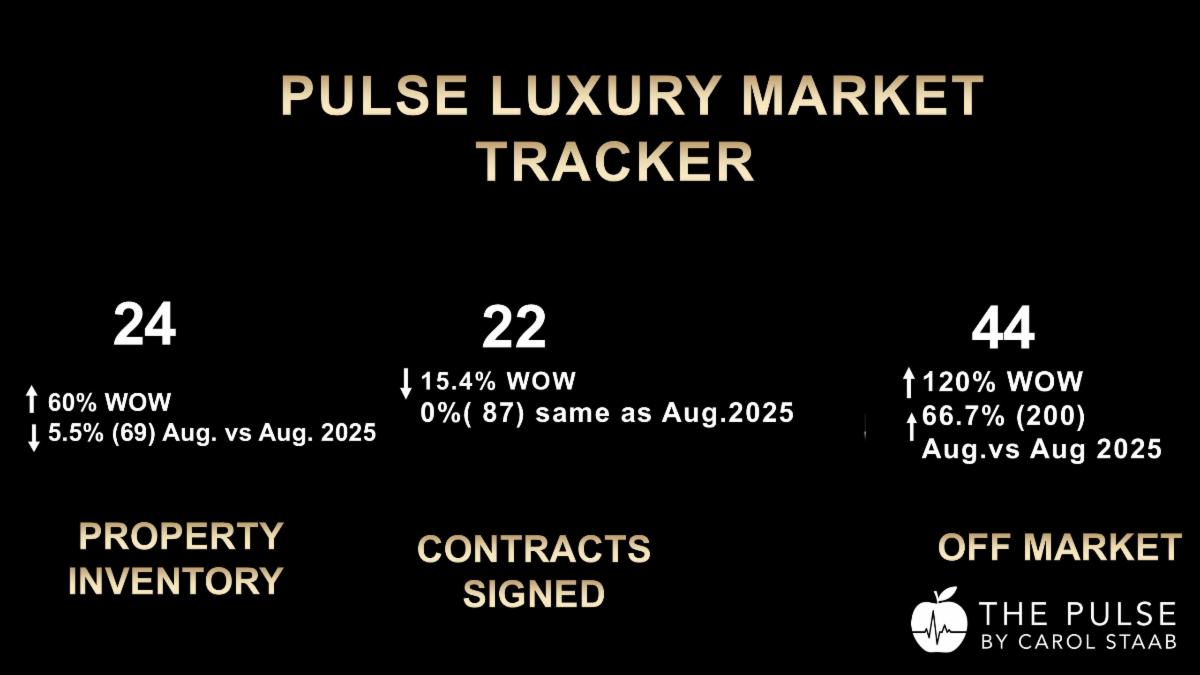
Twenty-two contracts signed this week in Manhattan's $4M+ luxury market. That number matters more than it looks.
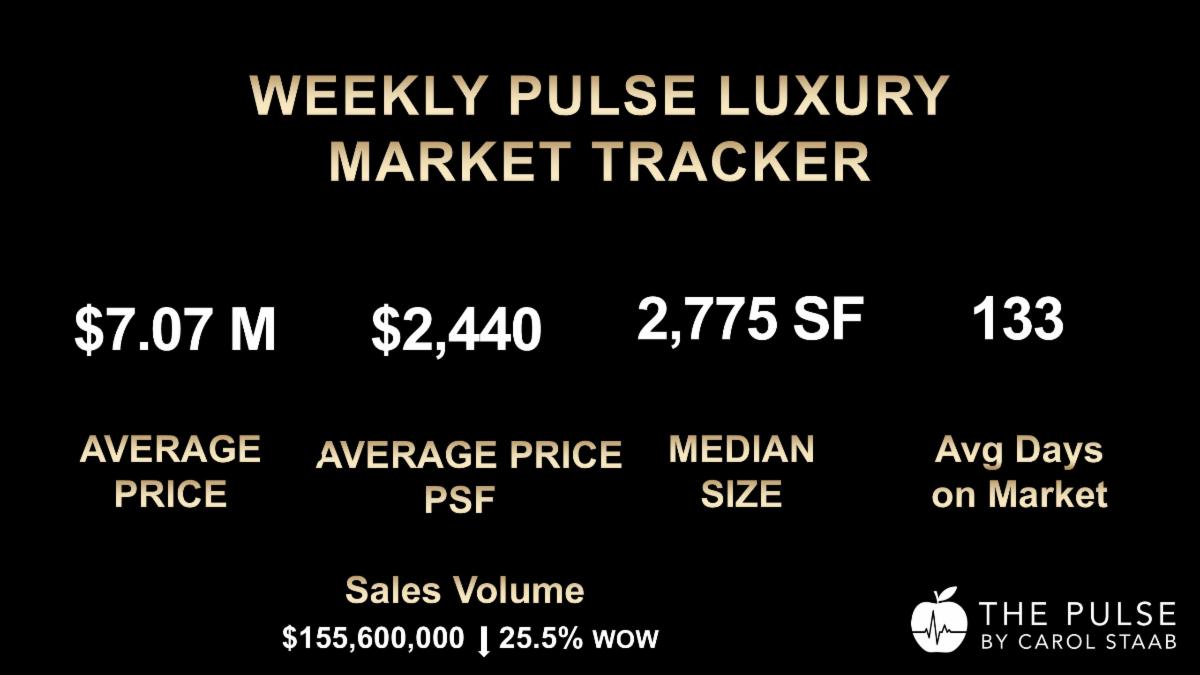
This is historically one of the slowest weeks of the year — and 22 puts us above the 20-contract health benchmark for the second straight week. $155.6M in asking-price volume. Three contracts above $10M totaling $48M. Four new-development contracts.
Down 15.4% from last week's 26, yes. But a week that normally produces mid-teens just delivered 22. That is not a slowdown. That is the market telling you where demand actually stands.
New listings jumped 60%. Off-market withdrawals more than doubled. Sellers are positioning for fall — and the buyers are already here.
If your property is entering or returning to the market this fall, the data below will tell you what the market is doing. If you want to know what the market is doing to your listing — that's a different conversation, and it's the one I specialize in.
[Email me here.]
Weekly Market Snapshot | Manhattan $4M+
- 22 contracts signed | ▼ 15.4% from 26 last week
- 24 new listings | ▲ 60.0% from 15 last week
- 44 listings went off market | ▲ 120.0% from 20 last week
- $155.6M asking-price volume | ▼ 25.5% from $208.6M last week
- 3 contracts above $10M | down from 4 last week
- 4 new-development contracts | 18.2% of total (vs. 19.2% last week)
Property Types & Market Share
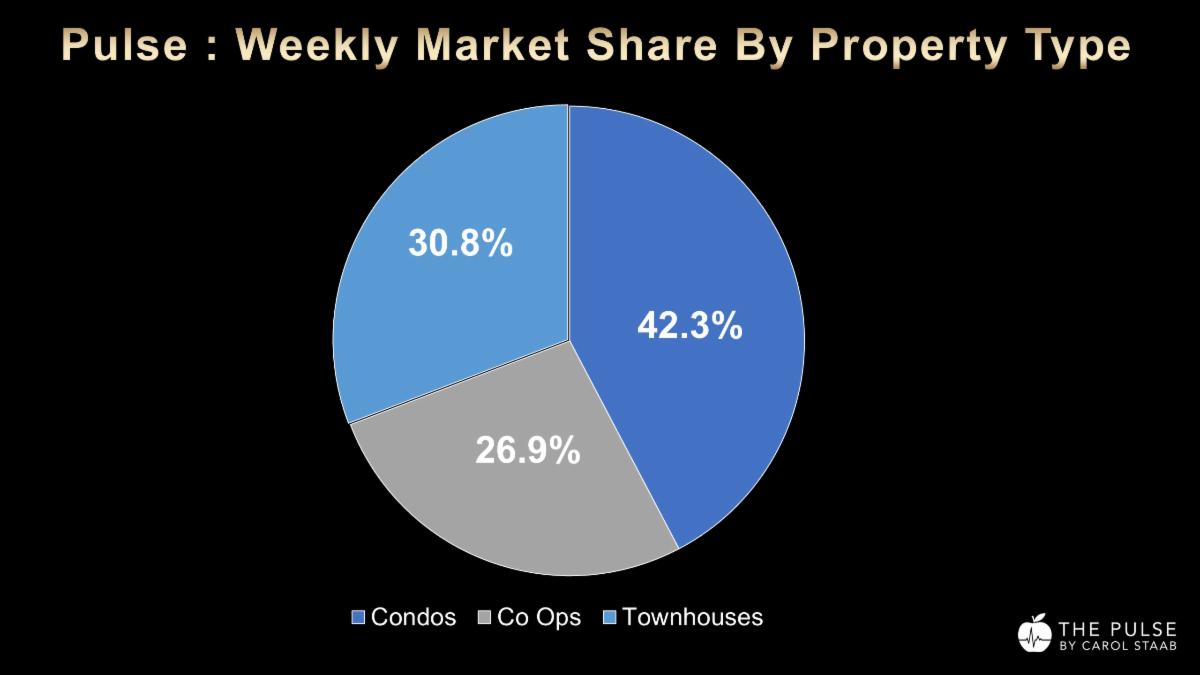
- Condos: 12 contracts — 54.5%
- Co-ops: 6 contracts — 27.3%
- Townhouses: 4 contracts — 18.2%
Condos reclaimed majority share this week, jumping twelve points. Co-ops held steady. Townhouses gave back nearly half their market share after an outsized August close.
Neighborhoods
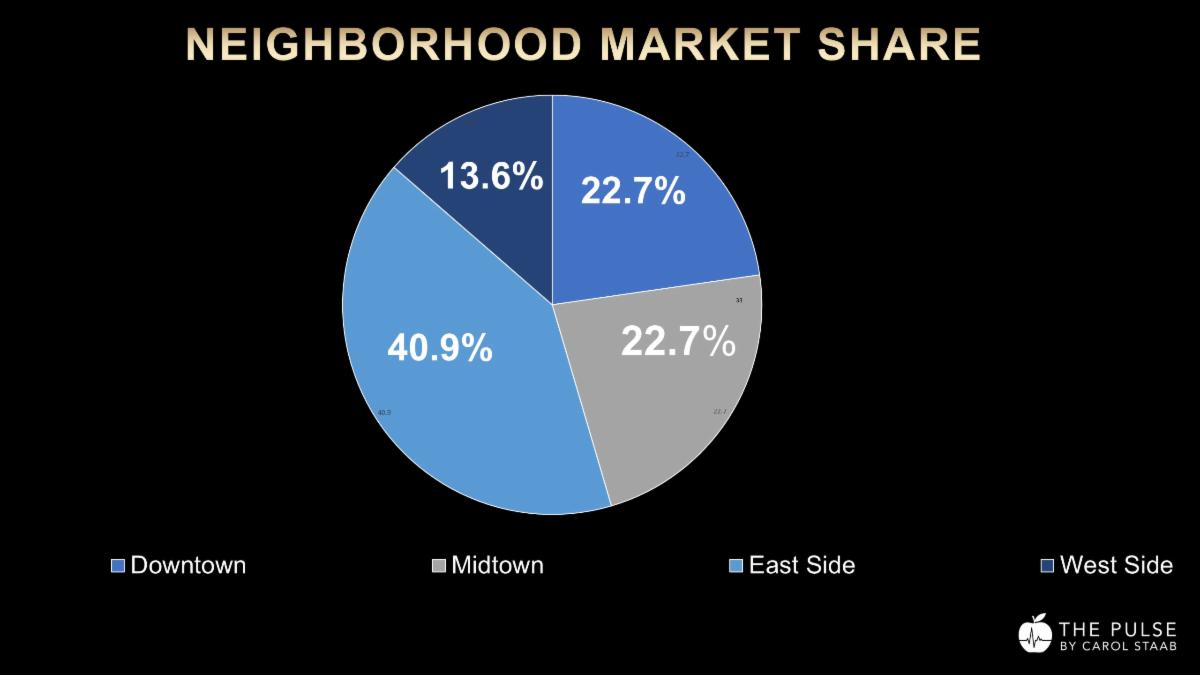
- East Side: 9 contracts — 40.9%
- Downtown: 5 contracts — 22.7%
- Midtown: 5 contracts — 22.7%
- West Side: 3 contracts — 13.6%
The East Side continues to dominate, holding above 40% market share for the second straight week. Downtown and Midtown split evenly. The West Side was the quietest corridor with just three contracts.
August 2026 vs. August 2025 | Manhattan $4M+
- Contracts signed: 87 vs 87 — flat (0.0%)
- Active listings: 69 vs 73 — ▼ 5.5%
- Off-market withdrawals: 200 vs 120 — ▲ 66.7%
Identical contract counts year over year — on 5.5% fewer active listings. Demand didn't flinch. Meanwhile 200 properties left the market in August, up 66.7% from last year. Many of those withdrawals are not true exits. Sellers are pulling lingering listings off StreetEasy to reset their days on market while keeping the property available through brokerage websites. Unless you are working with a broker who knows where to look, you will never see them. But a reset to zero does not solve what is actually holding a property back — price, presentation and promotion. Those are the three things that sell a home. A fresh clock without addressing them is just a longer wait.
Whether you are buying or selling this fall, the right broker does not just open doors — they see what is actually available and know what is actually working. If you want that perspective, I welcome the conversation. [Email me here.]
Top Contracts This Week- See All 22 Contracts
#1- Central Park Tower - 217 West 57th Street, Unit 68E | Midtown Center / New Development Condo =$20,500,000 | 3 beds, 3.5 baths, 3,364 ft² | $6,093/ft²
Signed Aug 28, 2026
#2- 880 Fifth Avenue, Unit PHA | Lenox Hill / Post War Co-op
$15,750,000 | 4 beds, 4.5 baths, 8 rooms
Signed Aug 28, 2026 | 71 days to contract
Both signed on the same day. A $20.5M condo at over $6,000 per square foot and a $15.75M Fifth Avenue co-op penthouse. That is not a market taking Labor Day off.
Market Pulse & Listing Climate
The $4M+ Market Pulse sits at 4.25 — seller territory, up across every timeframe.
The $10M+ segment hit 1.2, its sharpest monthly gain of the year.
Listing Climate tells a different story on the surface: 0.45 in the $4M+ segment, down 48.9% from last year, and 0.28 in the $10M+ segment. Both sit below the challenging market threshold. But the decline reflects the surge in off-market withdrawals — sellers pulling listings to reset days on market before relaunching in the fall. That depresses the ratio without reflecting an actual change in buyer demand.
The Market Pulse confirms it: demand is rising. The climate reading is a seasonal artifact, not a structural shift.
Why Prices Are Rising While Volume Stays Flat
UrbanDigs' John Walkup published an analysis this week that is especially relevant at the luxury level. Manhattan resale condo price per square foot is up 8.3% since January. Median sale prices are ahead of last year. Yet Q2 closings fell 8.6% year over year. Price and volume are doing different jobs right now.
The reason is structural. Active inventory is down 16.2% from a year ago. New-development pipeline inventory has contracted roughly 62% year over year. The cost of building new product keeps rising while existing apartments have not repriced to match. When replacement cost exceeds current pricing, existing inventory becomes more valuable by default.
In the ultra-luxury segment, the constraint is even more acute. The Real Deal recently reported that qualified buyers are parking themselves in $100K-per-month rentals because they cannot find purchase-quality inventory at the highest end. That is not a demand problem. That is pent-up capital waiting for the right product — and when the next quality listing hits the market correctly priced and well presented, it will move.( Manhattan's Rental Market is Booming with Units Reaching $100,000 per month- Robert Frank - Inside Wealth)
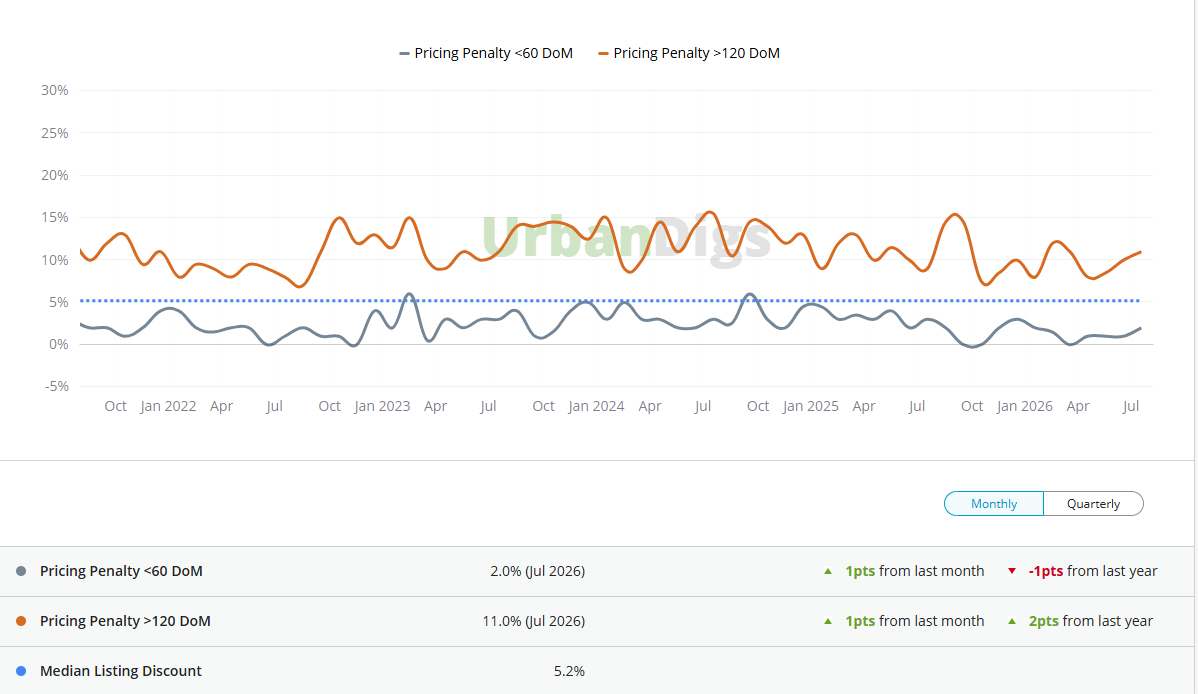
Chart Of The Week- July $4M & Over Pricing Penalty - See in Chart Box below
Median Discount - 5.5%
Under 60 Days on Market - 2%
Over 120 Days on Market- 11%
Seller Advice
Twenty-two contracts in one of the slowest weeks of the year. Eighty-seven in August — matching last year on fewer listings. The demand is real. But 200 properties left the market in August, up 66.7% from last year. Most will come back in the fall with a fresh clock on StreetEasy and the same problems. That will not work. A reset does not fix price, presentation or promotion. If your property did not trade this summer, something was wrong. Figure out what it was before you relaunch — or you are just running the same experiment and expecting a different outcome.
Buyer Advice
Prices are up 8.3% since January on 16.2% less inventory. That is not a soft market. Qualified buyers at the ultra-luxury level are renting at $100K a month because they cannot find what they want to own. When the right listing appears this fall, it will not sit. If you see it, move. The most expensive thing you can do in a thin market is wait.
Final Thoughts
The fall market is here. Inventory is not flooding in. Demand has not gone anywhere. The sellers who do the work — real repositioning, not a cosmetic reset — will trade. The buyers who act on data will close. Everyone else will still be talking about timing in January.
If you found this useful, share The Pulse with someone who needs to see these numbers.
And if you have a real estate question — buying, selling, or just trying to make sense of what you are seeing — email me or text me at 917-273-7787.That is what I am here for!
Warm regards,
Carol
Carol Staab
Sotheby's International Realty
Ranked by Real Trends -Top 1.5% of real estate professionals nationwide
Ranked by Real Trends #48 in NYC & #5 for individuals Sotheyb's NYC
Top 100 Sotheby's Company Wide Global Real Estate Sales Advisor
My Notable Sale Ritz Carlton $28.4M
Email: [email protected]
Cell: 917-273-7787
Website: CarolStaab.Com
Subscribe to the Pulse Here
|