Greetings!
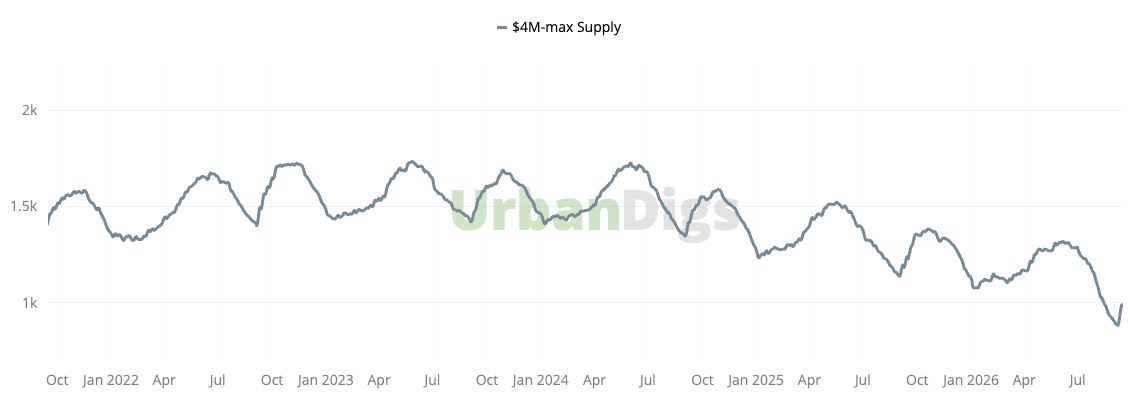
Manhattan luxury Inventory just hit a 12-year low.
There are 998 $4M-and-over listings on the Manhattan market right now. That is the lowest number since March 2014 — the peak of the last great Manhattan sales cycle.
Down 19.2% from a year ago. Up only 0.2% from last month. Down 10.6% year to date. Every time horizon points the same direction. Inventory is contracting, consistently, and the pace is accelerating. Could prices be next to rise? When supply is at a 12-year low and demand is holding steady, the conditions for upward pricing pressure are in place. It is not a guarantee — but it is a signal worth paying attention to heading into 2027.
Sixteen contracts were signed this week — below the 20-per-week benchmark for a healthy market. That number, by itself, might look soft. It is not.
Contract signings reflect accepted offers from roughly 15 days prior. This week's 16 deals were largely negotiated during the last, quietest stretch of August. Labor Day fell on September 7th this year, later than usual. The pattern every fall is the same: new listings come on right after the holiday — we saw that, 78 new arrivals this week. Then contracts follow two to three weeks later, once buyers have had time to tour, negotiate and go to contract. The first two weeks of September are historically the lowest-contracting period of the year. I would expect similarly modest numbers next week. The real measure of fall demand will show up the third and fourth weeks of September.
If your property is entering or returning to the market this fall, the data below will tell you what is happening. If you want to know what it means for your specific situation — pricing, positioning, timing — that is the conversation I specialize in. [Email me here.]
Chart of the Week: Manhattan Luxury Supply
Active Inventory: 973 ($4M+) — Lowest Since March 2014
Year over Year: ▼ 20.6%
Month over Month: ▼ 4.4%
Year to Date: ▼ 12.8%
[Supply Chart — See Chart Box Below]
March 2014 was defined by aggressive pricing, compressed days on market, and multiple-offer scenarios across the luxury segment. We are not in 2014. Rates, global capital and buyer psychology are all different. But the structural supply picture is strikingly similar: there are not enough well-positioned luxury properties available to meet the demand that exists. That imbalance rewards sellers who arrive early and price precisely — and it punishes hesitation.
Weekly Market Snapshot | Manhattan $4M+
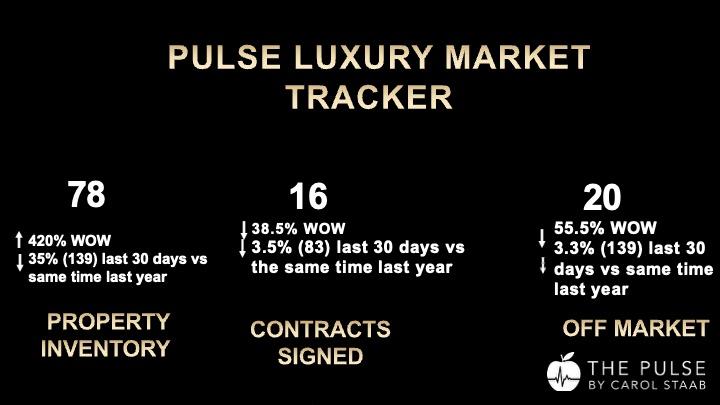
- 16 contracts signed | ▼ 38.5% from 26 last week
- 78 new listings | ▲ 420% from 15 last week
- 20 listings went off market | ▼ 54.5% from 44 last week
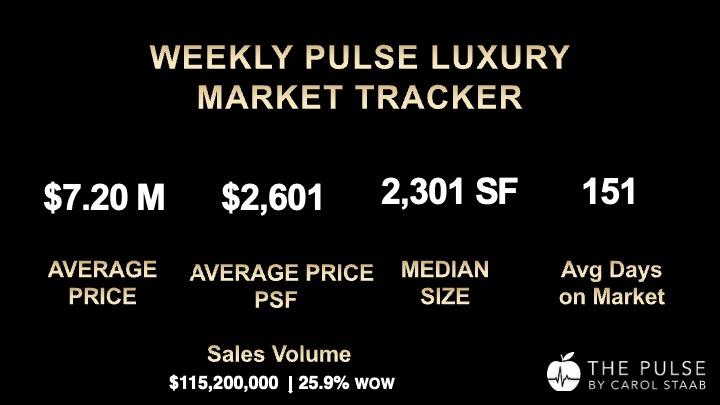
- $115.2M asking-price volume | ▼ 25.9% from $155.6M last week
- 2 contracts above $10M | down from 3 last week
- 3 new-development contracts | 18.8% of total (vs. 18.2% last week)
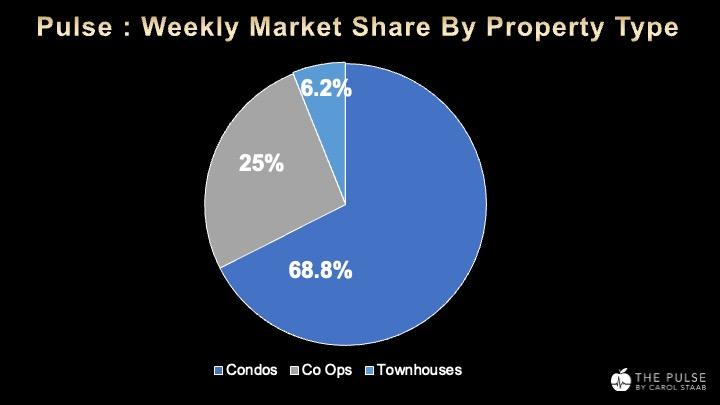
Property Types & Market Share
- Condos: 11 contracts — 68.8%
- Co-ops: 4 contracts — 25.0%
- Townhouses: 1 contract — 6.2%
Condos dominated with nearly 70% market share, up from 54.5% last week. Co-ops held steady at 25%, led by the week's biggest deal — a $22.5M maisonette at 2 East 70th Street. The sole townhouse, 111 East 81st at $13.995M, was a clear value play at $2,137 per square foot for the Upper East Side.
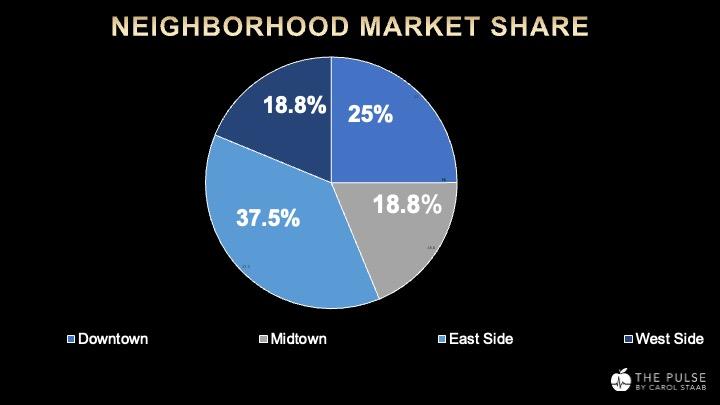
Neighborhoods
- East Side: 6 contracts — 37.5%
- Downtown: 4 contracts — 25.0%
- Midtown: 3 contracts — 18.8%
- West Side: 3 contracts — 18.8%
The East Side held above a third of all contracts for the third straight week. Downtown posted four deals across TriBeCa, the West Village and two in the Financial District. Midtown and the West Side split the balance evenly.
30-Day View | 2026 vs. 2025
- Contracts signed: 83 vs 86 — ▼ 3.5%
- New listings (active): 139 vs 214 — ▼ 35.0%
- Off market: 148 vs 153 — ▼ 3.3%
New listings are running 35% below last year — completely consistent with that 973 inventory figure. Contracts are essentially flat year over year, down just 3.5%. Fewer properties coming to market. Nearly the same number of buyers competing for them.
If you are a seller with a well-priced, well-presented property, this is a favorable setup. If you are a buyer, the 78 new listings this week may feel like abundance. The 30-day data says otherwise.
A Note for Buyers and Their Brokers
Last week I flagged that 200 properties left the market in August — up 66.7% from a year ago. Many of those sellers pulled lingering listings to reset their days on market before relaunching this fall. That relaunch wave has started.
With 78 new listings arriving this week, the fall market looks like it is offering fresh inventory. Some of it is. But a meaningful number of properties appearing as "new" this September were available earlier this year, temporarily removed, and relaunched with a reset clock.
This is not necessarily a red flag. But it requires homework. Look past the current days-on-market number. Pull the full listing history. What was the previous asking price? How long was it on the market the first time? Why was it withdrawn? A property that came off at $6.5M and reappeared at $5.9M tells you something very specific about where the seller's head is — and where your negotiating position starts.
A fresh clock on StreetEasy does not solve what actually held a property back. Price, presentation and promotion are still the three things that sell a home. The listing history is the diagnostic. Make sure you are reading it.
Market Pulse & Listing Climate
The $4M+ Market Pulse sits at 4.3 — seller territory, up across every timeframe. Up 0.9 points from last month, up 2.2 points year to date, up 2.6 points from last year. That is the strongest reading of the year. There are more buyers than there are well-positioned properties to sell them.
The $10M+ segment reads 0.55 — positive but more measured. Up month over month and year to date, though still down 0.6 points from last year. At $10M and above, the buyer pool is smaller and more selective. But it is active, and the direction is right.
Listing Climate tells a different story on the surface: 0.49 in the $4M+ segment, down 44.3% from last year, and 0.3 in the $10M+ segment, down 28.6%. Both sit below the challenging market threshold. But the decline reflects the same dynamic I flagged last week — 200 properties pulled off the market in August, up 66.7% from a year ago. That surge in withdrawals pushes the ratio down without reflecting an actual drop in buyer demand. The $10M+ segment jumped 150% from last month, which tells you deals are still getting done at the top even as listings churn.
The Market Pulse confirms it: demand is rising. The climate reading is a seasonal artifact, not a structural shift. Sellers who arrive correctly positioned this fall will find buyers waiting. Buyers who mistake the low climate reading for a soft market will find themselves competing for the best product — and negotiating from a weaker position than the headline number suggests.
Top 2 Listings - SEE DETAILS OF ALL 16 LISTINGS IN CONTRACT
#1 — 2 East 70th Street, Maisonette | Lenox Hill / Co-op
$22,500,000 | 4 beds, 4.5 baths, 10 rooms
Signed Sep 11, 2026 | 122 days to contract
#2 — 111 East 81st Street, House | Upper East Side / Townhouse
$13,995,000 | 5 beds, 4.5 baths, 10 rooms, 6,546 ft² | $2,137/ft²
Signed Sep 08, 2026 | 110 days to contract
A $22.5M co-op maisonette and a $14M townhouse — the week's two largest contracts both signed on the East Side and both closed within four months. At the top of the market, correctly positioned properties are still finding their buyers within a reasonable timeframe.
Pricing and Pace
Average price came in at $7.20M versus a $5.12M median — a $2M gap that tells you the two top contracts are pulling the average up. Strip them out and this was a $4M–$6M week. Seven of 16 contracts — 44% — were signed in that range.
Days on market held at 151. But the range within that number is where the real lesson lives. 1 Wall Street went to contract in one day at $7.5M. 11 East 73rd Street took 757 days. Same market. Same price tier. The difference is positioning — pricing, presentation and market strategy from day one.
Seller Advice
Nine hundred seventy-three $4M-and-over listings on the market. That is the lowest since March 2014 — down more than 20% from a year ago. The $4M+ Market Pulse is at 4.3, the strongest reading of the year. Demand is real and it is rising. You are entering the fall market with a supply advantage that has not existed in over a decade.
But scarcity alone does not sell a property. The sellers who traded this week arrived correctly priced and properly presented. The ones who sat for 757 days did not. With absorption running at 151 days, every week of overpricing is a week of lost leverage. If your property did not trade this summer, something was wrong. Figure out what it was before you relaunch — or you are just running the same experiment and expecting a different result.
Buyer Advice
The next two to three weeks will bring the broadest selection you have seen since spring. Seventy-eight new listings arrived this week with more coming. But do not mistake a seasonal surge for a shift in fundamentals. Inventory is down 20% year over year. The Market Pulse is at 4.3 and rising. Contracts are holding steady. This is a tight market dressed up in fall clothing.
When you find a property that meets your criteria, be prepared to move. And do your homework on listing histories — not everything that looks new this fall is new. A reset days-on-market counter does not change a property's actual market exposure. The data behind the listing matters as much as the listing itself.
Final Thoughts
Nine hundred seventy-three. That is the number that should frame every conversation this fall — listing, buying, or advising. Supply has not been this tight in over a decade. Demand is steady and rising. The sellers who do the work will trade. The buyers who act on data will close. Everyone else will still be talking about timing in January.
Whether you are buying or selling this fall, the right broker does not just open doors — they see what is actually available, know what is actually working, and understand the data behind both. If you want that perspective, I welcome the conversation.
If you found this useful, share The Pulse with someone who needs to see these numbers.
And if you have a real estate question — buying, selling, or just trying to make sense of what you are seeing — email me or text me at 917-273-7787. That is what I am here for.
Warm regards,
Carol
Carol Staab
Sotheby's International Realty
Ranked by Real Trends -Top 1.5% of real estate professionals nationwide
Ranked by Real Trends #48 in NYC & #5 for individuals Sotheyb's NYC
Top 100 Sotheby's Company Wide Global Real Estate Sales Advisor
My Notable Sale Ritz Carlton $28.4M
Email: [email protected]
Cell: 917-273-7787
Website: CarolStaab.Com
Subscribe to the Pulse Here
|